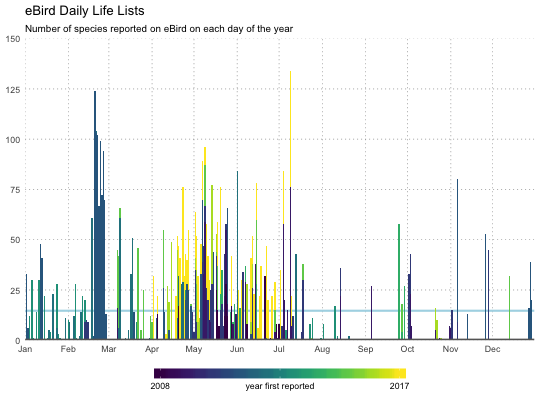
eBird daily life list
Generate a daily life list, i.e. for each day of the year list the species
seen on that day regardless of year. For each species, the year in which that
species was first observed is shown. Use summary() to summarize the list of
species seen each day into counts of the number of species seen each day.
To visualize your day life lists, use plot(). The concept of the daily
life list was introduced to me by Drew Weber.
eb_lifelist_day(x)

# S3 method for eb_lifelist_day
summary(object, by_year = FALSE, ...)

# S3 method for eb_lifelist_day
plot(x, title, subtitle, ...)
Arguments
| x | eb_sightings object; your personal eBird sightings |
|---|---|
| object |
|
| by_year | logical; whether to retain the year first when tallying up
species. Set this to |
| ... | not used |
| title | character; plot title. |
| subtitle | character; plot subtitle. |
Value
A dplyr::tibble, with additional class eb_lifelist_day,
containing your personal sightings.
Methods (by class)
eb_lifelist_day: Summarize daily life lists into counts of species seen on each day.eb_lifelist_day: Visualize your day life lists
Examples
day_list <- system.file("extdata/MyEBirdData.csv", package = "auklet") %>%
  eb_sightings() %>%
  eb_lifelist_day()
summary(day_list)#> # A tibble: 173 x 3
#>    month   day     n
#>    <dbl> <int> <int>
#>  1     1     1    23
#>  2     1     2    33
#>  3     1     3     6
#>  4     1     4    12
#>  5     1     6    30
#>  6     1     7     1
#>  7     1     9    14
#>  8     1    11    30
#>  9     1    12    48
#> 10     1    13    41
#> # ... with 163 more rowsplot(day_list)