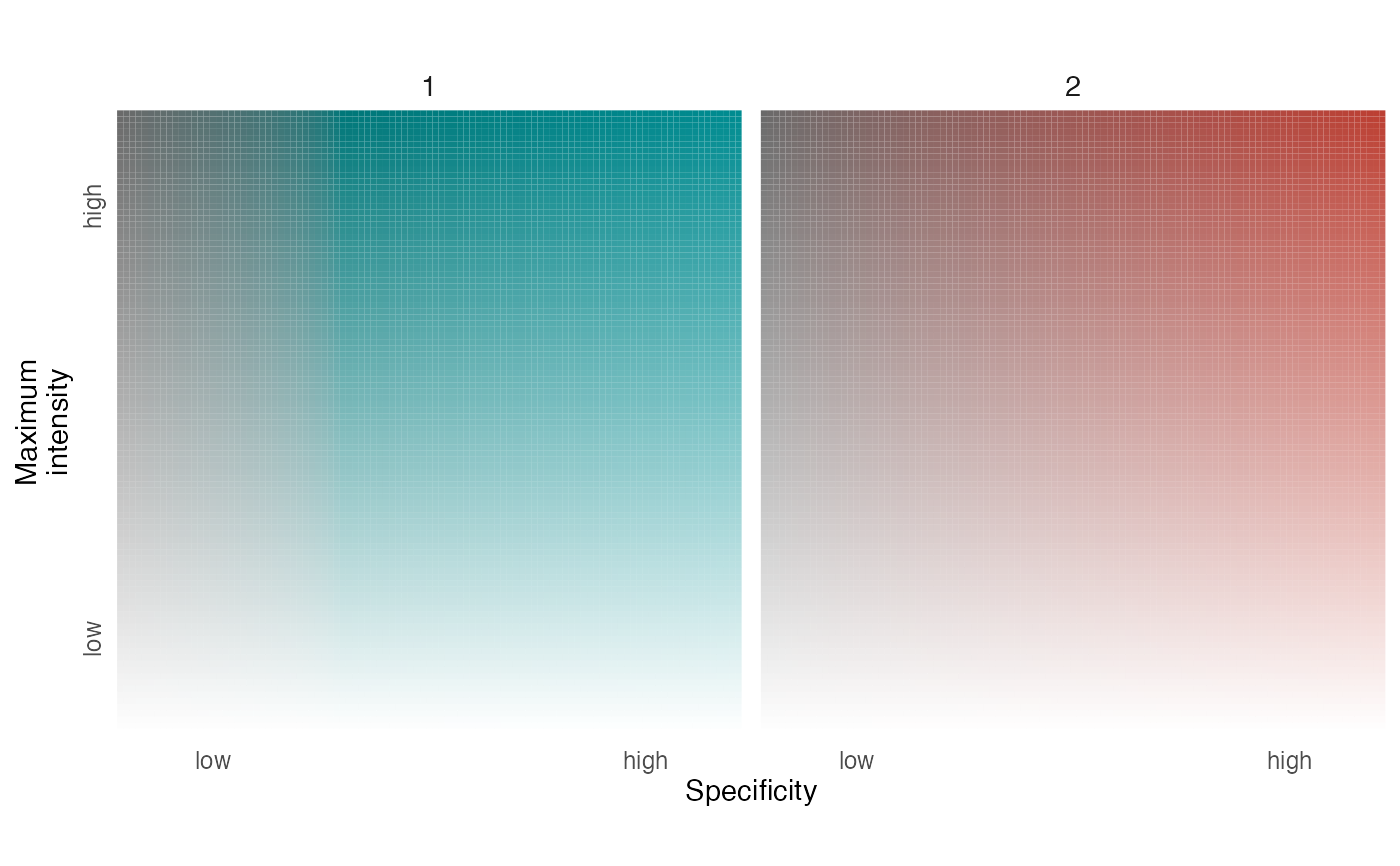
This function creates a legend to accompany a map describing an unordered set of distributions.
Arguments
- palette
data frame containing a color palette generated by palette_set.
- specificity
logical indicating whether to visualize intensity and layer information for the full range of potential specificity values (i.e., 0-100) or for a single specificity value (i.e., 100). Typically, a single specificity value is appropriate for map_multiples visualizations.
- group_labels
(axis_l) character vector with labels for each distribution.
- label_i
character vector with a single element describing the meaning of specificity.
- label_s
character vector with a single element describing the meaning of intensity values.
- axis_i
character vector with two elements describing the meaning of low and high intensity values.
- axis_s
character vector with two elements describing the meaning of low and high specificity values.
- return_df
logical indicating whether to return the legend as a
ggplot2object or return a data frame containing the necessary data to build the legend.
Value
A ggplot2 plot object of the legend. Alternatively,
return_df = TRUE will return a data frame containing a data frame
containing the data needed to build the legend. The data frame columns are:
specificity: the degree to which intensity values are unevenly distributed across layers; mapped to chroma.layer_id: integer identifying the layer containing the maximum intensity value; mapped to hue.color: the hexadecimal color associated with the given layer and specificity values.intensity: maximum cell value across layers divided by the maximum value across all layers and cells; mapped to alpha level.
See also
legend_timecycle for cyclical sequences of distributions and legend_timeline for linear sequences of distributions.
Other legend:
legend_timecycle(),
legend_timeline()
Examples
# load elephant data
data(elephant_ud)

# generate hcl palette
pal <- palette_set(elephant_ud)

# create legend for palettes
legend_set(pal)