This function creates a legend to accompany a map describing a cyclical sequence of distributions.
legend_timecycle(
palette,
specificity = TRUE,
origin_label = NULL,
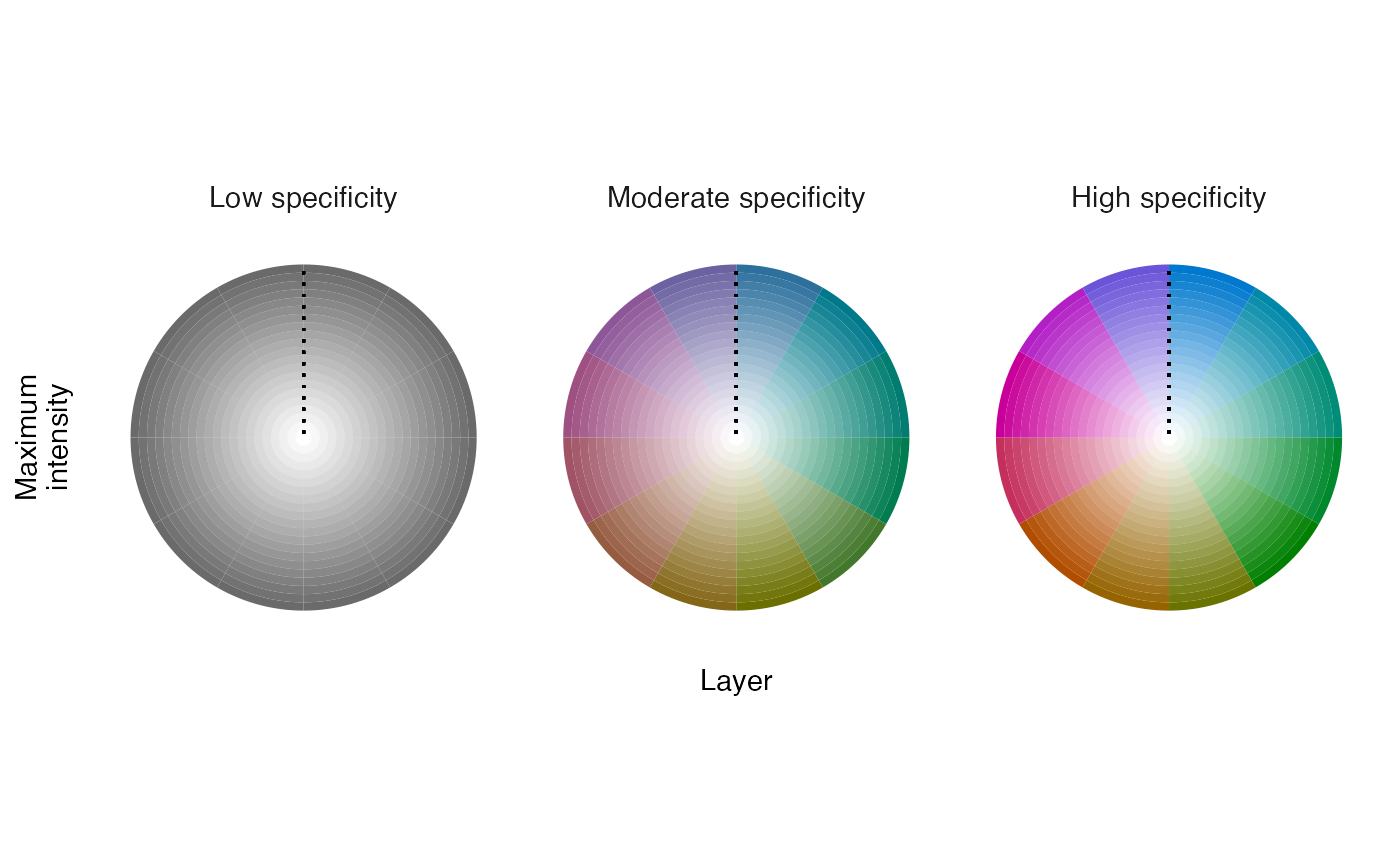
label_i = "Maximum\nintensity",
label_l = "Layer",
label_s = c("Low specificity", "Moderate specificity", "High specificity"),
return_df = FALSE
)Arguments
- palette
data frame containing a color palette generated by palette_timecycle.
- specificity
logical indicating whether to visualize intensity and layer information for three specificity values (i.e., 0, 50, 100) or for a single specificity value (i.e., 100). Typically, a single specificity value is appropriate for map_multiples visualizations.
- origin_label
character vector with a single element to be used as the label at the 12 o'clock position of the legend wheel.
- label_i
character vector with a single element describing the meaning of intensity values.
- label_l
character vector with a single element describing the meaning of layer values.
- label_s
character vector with three elements describing differences in the meaning of three specificity values (i.e., 0, 50, 100).
- return_df
logical indicating whether to return the legend as a
ggplot2object or return a data frame containing the necessary data to build the legend.
Value
A ggplot2 plot object of the legend. Alternatively,
return_df = TRUE will return a data frame containing the data needed
to build the legend. The data frame columns are:
specificity: the degree to which intensity values are unevenly distributed across layers; mapped to chroma.layer_id: integer identifying the layer containing the maximum intensity value; mapped to hue.color: the hexadecimal color associated with the given layer and specificity values.intensity: maximum cell value across layers divided by the maximum value across all layers and cells; mapped to alpha level.
See also
legend_timeline for linear sequences of distributions and legend_set for distributions of distinct groups.
Other legend:
legend_set(),
legend_timeline()
Examples
# load field sparrow data
data(fiespa_occ)

# generate hcl palette
pal <- palette_timecycle(fiespa_occ)

# create legend for palette
legend_timecycle(pal)